Color Inversion on a Huge Chessboard

시간 제한4초메모리 제한1024 MB

요약
체스판 색배치에서 시작해 행 또는 열의 색을 뒤집는 연산을 순서대로 적용하면서, 매 연산 후 같은 색으로 이어진 영역의 개수를 구한다.
난이도

어려움10점 중 8점

유형
유니온 파인드, 행렬, 구현, 수학
정답자
아직 제출이 없습니다

문제

You are given a set of square cells arranged in a chessboard-like pattern with nn horizontal rows and nn vertical columns. Rows are numbered 11 through nn from top to bottom, and columns are also numbered 11 through nn from left to right.

Initially, the cells are colored as in a chessboard, that is, the cell in the row ii and the column jj is colored black if i+ji + j is odd and is colored white if it is even.

Color-inversion operations, each of which is one of the following two, are made one after another.

Invert colors of a row: Given a row number, invert colors of all the cells in the specified row. The white cells in the row become black and the black ones become white.

Invert colors of a column: Given a column number, invert colors of all the cells in the specified column. The white cells in the column become black and the black ones become white.

The number of distinct areas after each of the operations should be counted. Here, an area means a group of directly or indirectly connected cells of the same color. Two cells are said to be directly connected when they share an edge.

입력

The input consists of a single test case of the following format.

nn qq

operation_1operation\_1

⋮\vdots

operation_qoperation\_q

The integer nn is the number of rows and columns (1≤n≤5×1051 ≤ n ≤ 5 \times 10^5). The integer qq is the number of operations (1≤q≤5×1051 ≤ q ≤ 5 \times 10^5). The following qq lines represent operations to be made in this order. Each of them is given in either of the following forms.

  • ROW ii: the operation “invert colors of a row” applied to the row ii (1≤i≤n1 ≤ i ≤ n).
  • COLUMN jj : the operation “invert colors of a column” applied to the column jj (1≤j≤n1 ≤ j ≤ n).

출력

Output qq lines. The kk-th line should contain an integer denoting the number of areas after the kk-th operation is made.

힌트

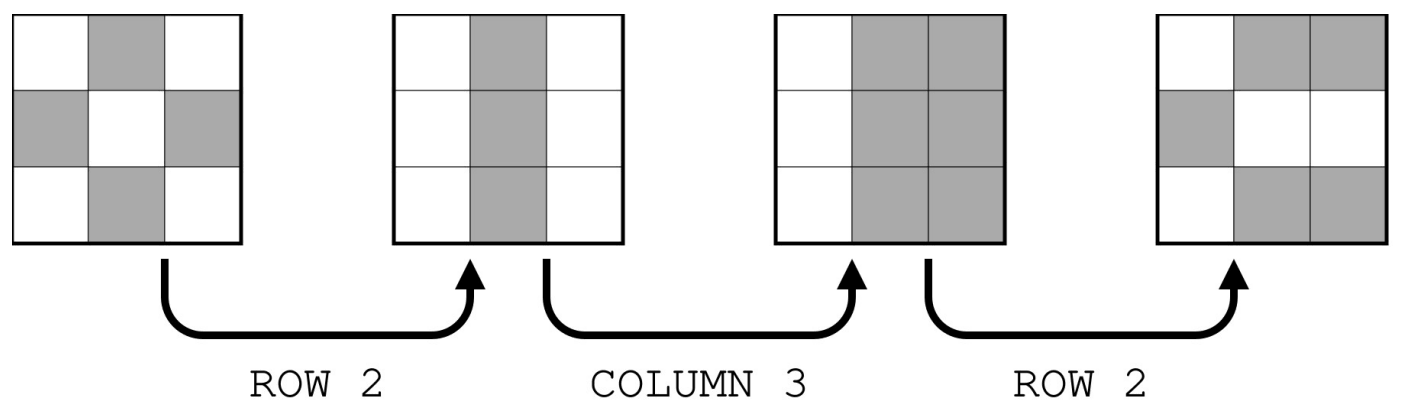
Figure F.1. Illustration of Sample Input 1

예제2

  1. 예제 1

    입력
    3 3
    ROW 2
    COLUMN 3
    ROW 2
    
    예상 출력
    3
    2
    6
    
  2. 예제 2

    입력
    200000 2
    ROW 1
    ROW 1
    
    예상 출력
    39999800000
    40000000000