Gray Area
Time limit1sMemory limit128 MB
Compute weighted ink used by a histogram where each bar contributes its normalized height times a linearly decreasing darkness, plus a fixed constant.
- Level
Easy3 of 10
- Topics
- Array, Simulation, Math
- Solved
- No attempts yet
Problem
Seokwon Lee, a data analyst at the successful startup "Bongssi", receives information about users all over the world every day and visualizes it with a tool he built himself.
The figure below is a histogram made with his tool.
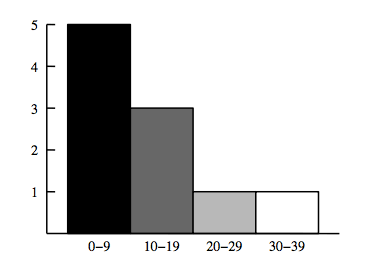
In this example the interval 0-9 occurred 5 times, 10-19 occurred 3 times, and 20-29 and 30-39 each occurred once.
His histogram program is very simple. First, the height of the histogram is fixed: the tallest bar always has the same height, and every other bar's height is set in proportion to the tallest one. The bar width is also fixed, so each value interval has a fixed size as well (10 in the figure above).
Finally, the bars are shaded by position: the leftmost bar is black (darkness 1), the rightmost bar is white (darkness 0), and the bars in between get lighter from left to right at a constant rate. For example, the darkness values of the four bars in the figure above are 1, 2/3, 1/3, 0.
Write a program that computes the amount of ink needed to draw the histogram. The ink needed for each bar is proportional to its area times its darkness.
Input
The input consists of several test cases. The first line of each test case contains the number of values and the interval size . The values follow. The first bar covers the interval , the second covers , and the remaining bars are defined the same way. Every bar from the first up to the bar that contains the largest value must be drawn, even if it contains no values. (, , .)
The largest value is not smaller than , so the histogram always has more than one bar.
The last line of the input contains two zeros.
Output
For each test case, print the amount of ink needed to draw the histogram.
Drawing the tallest bar entirely black takes unit of ink, and drawing the axes and labels takes unit. Because a bar's area is proportional to its height, and its height is proportional to how many values fall in it, each bar contributes (its value count divided by the largest value count) times its darkness, and the axes and labels add a fixed .
Print the amount rounded to exactly six digits after the decimal point (as produced by printf("%.6f")). No test case's true value lies on a half-way rounding boundary.