Planning Rolling Blackouts
Time limit3sMemory limit512 MB
Partition an h by w grid by recursive guillotine cuts so that the heaviest set of groups left powered stays within capacity, maximizing the group count and then the reserve.
- Level
Hard9 of 10
- Topics
- Dynamic programming, Prefix sum, Divide and conquer, Implementation
- Solved
- No attempts yet
Problem
Facing a seriously tight balance between power supply and demand, the electric power company you work for introduced rolling blackouts this spring. It divided the service area into several groups of towns and divided each day into several blackout periods. In each blackout period, exactly one group — alternating from one group to the next — is cut off from electricity. By keeping the total demand of the remaining towns within the supply capacity, the company avoided an unforeseeable large-scale blackout.
Working in the customer relations department, you had to field many complaints, which convinced you that a better scheme was possible. Most complaints were about the frequent cut-offs; dividing the area into more groups would make each group's cut-offs less frequent. Other complaints were about the complicated grouping (someone even said the group shapes looked like fractals), which made it hard to tell which town belonged to which group without carefully studying the published list. Because the service area is rectangular and the towns sit on a grid, you believe a much simpler grouping is possible.
When you explained your analysis to the company president, you were put in charge of planning this summer's rolling blackouts. You must divide the service area into as many groups as possible while keeping the total demand within the supply capacity, and the groups must be simple and easy to remember.
Given a demand table (the electricity demand of each town) and the supply capacity, write a program that reports a grouping of towns satisfying all of the following conditions.
- The grouping is produced by repeatedly splitting the area horizontally or vertically. Formally, start from the set containing only the entire area, then apply the following step zero or more times: remove one area from the set, split it either vertically or horizontally into two sub-areas, and put both sub-areas back into the set. (This is a guillotine partition.)
- The maximum suppressed demand of the grouping — the greatest possible total demand of all groups except one — is at most the supply capacity.
- Among all groupings satisfying conditions 1 and 2, the grouping has the largest number of groups.
- Among all groupings satisfying conditions 1, 2, and 3, the grouping has the greatest reserve power, where the reserve power is the difference between the supply capacity and the maximum suppressed demand.
Note that condition 1 forbids a grouping such as the one shown in Figure E-1.
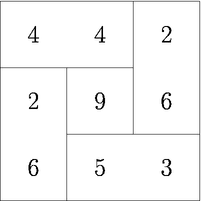
Figure E-1: A grouping that violates condition 1
Input
The input consists of one or more datasets. Each dataset is given in the following format.
h w s
u11 u12 ... u1w
u21 u22 ... u2w
...
uh1 uh2 ... uhw
The first line contains three positive integers , , and : the height and width of the demand table and the power supply capacity. Each of the following lines contains integers, where is the demand of the town at row , column . These values satisfy:
You may assume that the supply capacity is strictly less than the total demand of the whole area.
The end of the input is indicated by a line containing three zeros.
Output
For each dataset, print one line with two integers: the number of groups in a grouping that satisfies the conditions, and the reserve power. The two numbers must be separated by a single space, with no other characters on the line.