Microspikes
Time limit1sMemory limit128 MB
Given interleaved per-appliance power change records with relative times, reconstruct the total power timeline and count maximal above-threshold intervals of duration 1 to S that start and end.
- Level
Medium6 of 10
- Topics
- Simulation, Sorting, Prefix sum, Implementation
- Solved
- No attempts yet
Problem
In a study of domestic power use, researchers built a simulator for residential homes. For each home the software simulates the power consumption of its appliances. The goal is to identify microspikes in power usage: short intervals during which the total power consumption rises above a specified limit.
Before a simulation starts, all appliances are off (drawing no power). At various times during the simulation an appliance increases or decreases its power draw. Every time this happens the simulator emits a record containing the appliance number, the time in seconds since that appliance's previous change (or since the start of the simulation for its first change), and the change in power level in watts.
For any single appliance the records appear in chronological order. However, records for different appliances are interleaved arbitrarily, so a record for appliance written before a record for appliance does not imply that 's event occurred before 's.
Given a power threshold and a time threshold , a microspike is a maximal interval during which the total power stays strictly above () and whose duration in seconds satisfies . A microspike is counted only when both its start (total power rising strictly above ) and its end (total power falling back to or below) are reported. Appliances that are still above the threshold when the simulation ends are never turned off, so an interval that never returns to or below is not counted.
Read the records for one or more simulations and count how many microspikes occur in each.
Input
The input describes one or more simulations. Each simulation begins with a line holding three integers , , and separated by single spaces, where is the total simulation time in seconds (), is the power threshold (), and is the time threshold ().
The header line is followed by up to power-change lines (). Each holds three integers , , and separated by single spaces: is the appliance number (); is the time in seconds since that appliance's previous change (); and is the change in power level in watts (). A line 0 0 0 marks the end of the power-change lines for the current simulation.
A simulation header line equal to 0 0 0 ends the entire input. You may assume that the power level of any single appliance never becomes negative and that the total power consumption never exceeds . All power changes take effect instantaneously at the start of the indicated second.
Output
For each simulation, print a single line containing the number of microspikes observed.
Note
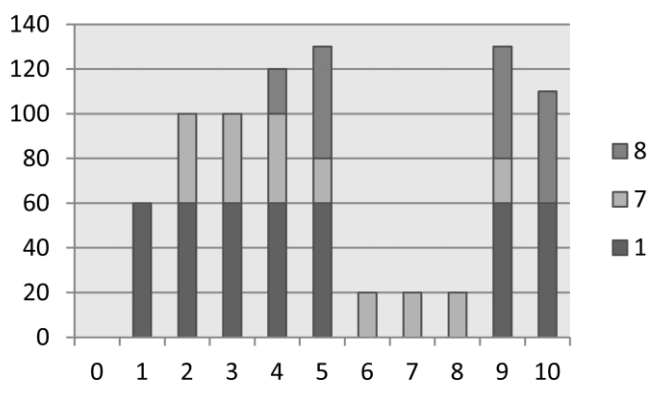
Total power consumption for the example input. The labels on the horizontal axis mark the start of each second. All power changes take effect instantaneously at the start of a second. The bar drawn at time is not part of the simulation; it is shown only to indicate the power level that continues after the simulation ends.