Lecture Screens
Time limit1sMemory limit128 MB
Given a simple polygon hall, a viewpoint, and directed screens, compute the total fraction of shared content visible across all screens after occlusion by the walls.
- Level
Hard8 of 10
- Topics
- Geometry, Implementation, Sorting, Math
- Solved
- No attempts yet
Problem
Many lecture halls show the same slides on several displays at once, so that a pillar or the head of the person in front of you cannot completely block your view. How much of the presented content you actually see depends on where you sit.
We model this as follows. We ignore people's heads and consider only architectural obstruction. The lecture hall is given as a closed, simple polygon (its walls do not cross). You are also given several screens as line segments in the plane, together with your own position inside the polygon.
Every screen shows the same content, running from its left endpoint (0% of the content) to its right endpoint (100%). From your position you may see all, part, or none of a given screen. Taking the union of everything you can see, we want the total fraction of the content you get. For example, if you see the left half of one screen and the right half of another, you see 100%; if you see only the left half of both, you see just 50%.
A screen can only be read from its front. Each screen is directed from its left endpoint to its right endpoint; if you view it from behind (its right side appears on your left), you see none of its content.
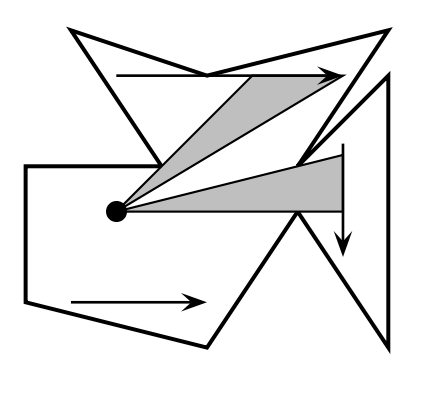
In the illustration, the thick lines are the walls of the hall. The arrows are the screens and point from their left to their right side. The gray regions are your view cone, and where a cone meets an arrow is the part of that screen you can see. The screen below the viewer faces the wrong way, so it is not visible. In this example you can see 90% of the content (everything except the leftmost 10%).
Input
The first line contains an integer , the number of data sets. Each data set has the following form.
The first line contains , , , , where is the number of corner points of the polygon, is the number of screens, and is your seating position ( and are real numbers).
The next lines each contain two real numbers and , the -th corner of the hall. There is a wall from to for every , and a wall from back to .
The following lines each contain four real numbers , , , : the coordinates of the left endpoint and the right endpoint of the -th screen.
Output
For each data set, first print a line "Data Set x:", where is its number (starting from 1). Then print the percentage of the content you can see, rounded to two decimal places, followed by a percent sign.