Noise Effect

Interview

Time limit1sMemory limit128 MB

Summary
Given two L by L grayscale images, find the highest percentage of scanned pixels whose value differs from the corresponding standard pixel by at most 100 over the eight rotations and flips.
Level

Medium4 of 10

Topics
Implementation, Math, Brute force
Solved
No attempts yet

Problem

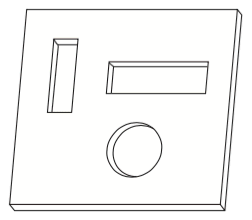
Cheap, small industrial scanners can only capture grayscale images, in which each pixel holds an integer intensity in the range [0,255][0, 255]. A company that builds vending machines wants to use these inexpensive scanners to validate the tokens its machines accept. A token is a small square metal chip with holes punched in specific positions; tokens with different hole patterns represent different values.

A token for a vending machine

Fig. 1: Token for a vending machine

When a customer inserts a token, the scanner produces an image of it and a program decides whether the token is valid. In the scanned image, metal shows up as dark pixels (values near 00) and holes as light pixels (values near 255255). Two difficulties complicate the check. First, because the token is square, the customer can drop it into the slot in several orientations: any of the four 90°90° rotations, and, because the chip can also be flipped over, the mirror image of each rotation — eight orientations in total. Second, these cheap scanners are noisy, so the captured image contains errors. To validate the token, the machine compares the scanned image against a standard image of the token that was previously captured with a high-quality scanner.

Write a program that, given the standard image and a scanned image, reports the confidence degree that the inserted token is valid. The confidence degree is the percentage of pixels in the scanned image whose intensity differs by at most 100100 from the corresponding pixel of the standard image. Because the token may have been inserted in any of the eight orientations, report the highest confidence degree over all of them.

Input

The input contains several test cases. Each test case begins with a line holding one integer LL, the side length of the square image in pixels (1≤L≤4001 \le L \le 400). The next LL lines contain LL integers each and give the pixel values of the standard image, row by row. The following LL lines give, in the same way, the pixel values of the scanned image. Every pixel value is an integer in [0,255][0, 255].

The input ends with a line containing L=0L = 0, which must not be processed.

Output

For each test case, print a single line with the confidence degree for that image. Print it as a real number rounded to exactly two decimal places. (The test data avoid values that fall on a rounding boundary.)

Examples2

  1. Example 1

    Input
    4
    250 251 249 250
    251 120 245 248
    248 5 190 247
    5 5 180 246
    0 1 240 240
    250 2 250 254
    244 251 255 253
    230 250 250 252
    3
    250 250 250
    150 0 150
    250 2 250
    253 150 253
    0 2 248
    251 150 250
    5
    255 255 255 255 255
    255 0 255 0 0
    255 0 0 255 255
    255 255 0 255 255
    255 255 255 255 0
    255 0 255 255 0
    255 0 255 255 255
    255 255 0 0 255
    255 0 0 255 255
    154 154 255 255 255
    0
    
    Expected output
    93.75
    100.00
    92.00
    
  2. Example 2

    Input
    1
    100
    150
    0
    
    Expected output
    100.00