Railway Connection
Time limit1sMemory limit128 MB
Find the cheapest route from station s to g in a multigraph where each maximal run of same-company edges is priced by that company's piecewise linear, concave fare table.
- Level
Hard8 of 10
- Topics
- Graph, Shortest path, Dynamic programming, Implementation
- Solved
- No attempts yet
Problem
Tokyo has a very complex railway system. The figure below shows a partial map of its lines and stations.
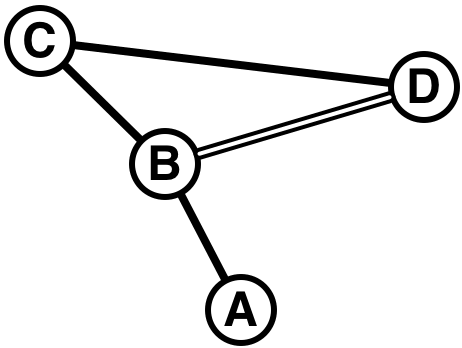
A sample railway network.
Suppose you want to travel from station A to station D. The path with the shortest distance is clearly A → B → D. However, the shortest path is not necessarily the cheapest. Suppose lines A–B, B–C, and C–D are operated by one railway company, while line B–D is operated by another. Then the path A → B → C → D may cost less than A → B → D.
The reason is that fares are not proportional to distance: usually, the longer the distance, the lower the fare per unit distance. When you use lines from more than one company, the fares charged by each company are simply added together, so a shorter route that mixes companies may end up costing more.
Given a railway network with several companies and each company's fare table (the rule that turns a distance into a fare), together with a starting station and a goal station, write a program that computes the minimum possible total fare.
Input
The input consists of multiple datasets, each in the following format.
n m c s g
x_1 y_1 d_1 c_1
...
x_m y_m d_m c_m
p_1 ... p_c
q_1,1 ... q_1,(p_1 - 1)
r_1,1 ... r_1,p_1
...
q_c,1 ... q_c,(p_c - 1)
r_c,1 ... r_c,p_c
Every value is a non-negative integer, and values on the same line are separated by a single space.
The first line describes the network and the trip. is the number of stations (). is the number of lines connecting two stations (). is the number of railway companies (). is the index of the starting station and is the index of the goal station (, ).
The next lines describe the lines. Line connects stations and (, ) and can be traveled in both directions. Two stations may be connected by more than one line. is the length of line (), and is the index of the company operating it ().
Each company's fare table is a piecewise-linear function of distance. For company , is the number of segments (). The values (, ) are the distances at which the segments change, and (, ) is the fare added per unit distance in segment . Writing for the fare of distance ,
where , , and .
For example, if , , , , , and , the fare table is:
The values increase with , and the values decrease with .
The last dataset is followed by a line containing five zeros separated by spaces, which must not be processed.
Output
For each dataset, output on a single line the minimum possible total fare of a route from the start to the goal. If the goal cannot be reached from the start, output -1 instead. Do not print any extra characters such as trailing spaces.
Given a route, its total fare is computed as follows. Split the route into maximal groups of consecutive lines operated by the same company. For each such group, add the lengths of its lines and use that combined distance to look up the fare from the company's fare table. The total fare of the route is the sum of the fares of these groups. If a line of a different company is used between two lines of the same company, those two lines belong to separate groups and their fares are computed independently. No company offers any transfer discount.