Easy Trading
InterviewTime limit2sMemory limit128 MB
Given daily prices, compute moving averages over the last m and n days and print a buy or sell signal whenever the trend between them reverses.
- Level
Easy3 of 10
- Topics
- Array, Prefix sum, Simulation, Implementation
- Solved
- No attempts yet
Problem
Frank is a professional stock trader at Advanced Commercial Markets Limited (ACM Ltd). He likes "easy trading" — using a simple strategy to decide when to buy stock and when to sell it.
Frank keeps a database of historical daily stock prices. His strategy has two integer parameters and (). Every day he computes two values: , the average stock price over the previous days, and , the average stock price over the previous days. signals an upward (bullish) trend, and signals a downward (bearish) trend. In practice and are never equal.
When the trend reverses from bearish to bullish, it is a signal for Frank to buy. When it reverses from bullish to bearish, it is a signal to sell.
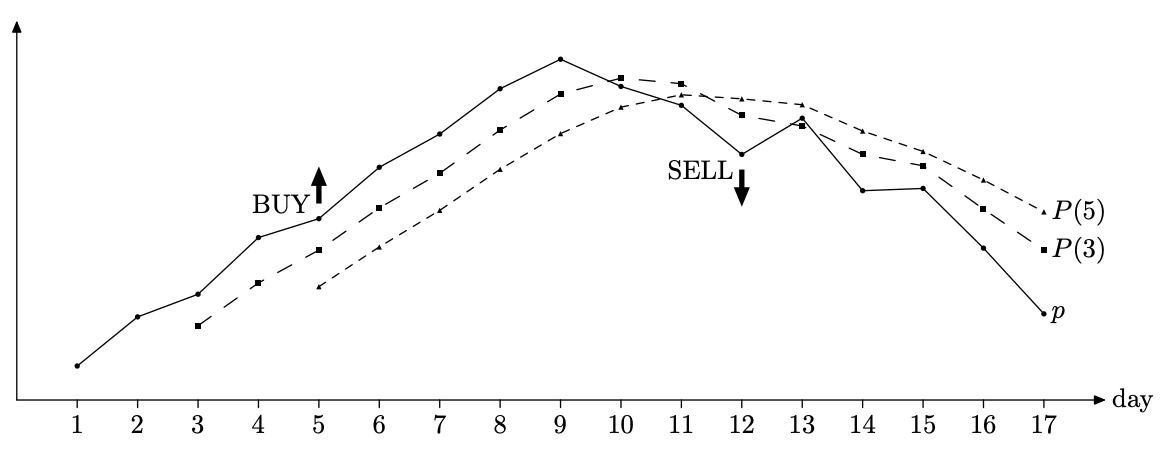
Frank has several candidate pairs of and in mind and wants to backtest them on historical prices. He takes historical prices (; for ). For each day () he computes and , the arithmetic averages of and respectively.
Backtesting generates signals by these rules:
- If , day has a bullish trend, and a
BUY ON DAY isignal is generated when or day was bearish. - If , day has a bearish trend, and a
SELL ON DAY isignal is generated when or day was bullish.
Write a program that backtests a given strategy: print the signal for the first tested day (day ), followed by the signals for the remaining days in increasing order of day number.
Input
The first line contains three integers , , and . The next lines contain the stock prices for days to . Each price has exactly two digits after the decimal point. The prices are guaranteed to satisfy for all ().
Output
Print the list of signals, one per line, as described above.