Tracking Robots
Time limit1sMemory limit128 MB
Count the fewest and most robots whose walks from region 1 interleave to produce the recorded region-label stream.
- Level
Hard8 of 10
- Topics
- Graph
- Solved
- No attempts yet
Problem
Several robots move around inside an area and send their positions to a server. The server sees only the stream of positions and has to work out how many robots are in the area.
The area is a closed polygon cut into non overlapping regions labeled . Every robot begins in region and then starts moving around. A robot moves only into a region adjacent to the one it is in, and every time it enters a new region it sends that region's label to the server. A robot may enter and leave the same region many times.
The server receives one long stream of region labels and does not know which robot sent each label.
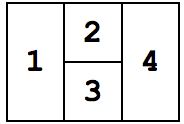
Assume every robot sent a region label at least once. Find the minimum and the maximum number of robots that could have produced the stream.
Input
The input holds several test cases. The first line of a test case has the number of regions () and the length of the server's stream (). Each of the next lines describes one region, and the th of them describes region . Such a line starts with , the number of regions adjacent to region , followed by the labels of those regions. The next line has the region labels of the stream, in the order the server received them. The input ends with a line containing 0 0.
The given stream is always one that some group of robots could really have produced.
Output
For each test case print one line with the minimum and the maximum possible number of robots in the area, separated by a space.