Regions Cut by Rectangles
Time limit5sMemory limit128 MB
Count the regions into which up to 50 axis-aligned rectangle borders divide the plane, including the outer unbounded region.
Problem
There are several rectangles on the x-y plane. Every side of every rectangle is parallel to the x-axis or the y-axis, and every rectangle lies inside the coordinate range given in the input. The coordinates have no other restriction.
The sides of the rectangles cut the plane into regions. One region can be bounded by the sides of a single rectangle, or by sides of several rectangles mixed together. In Figure 1 of the hint, three rectangles overlap one another and the plane is cut into eight regions.
Rectangles can overlap in more complicated ways. Two rectangles can share part of a side, they can touch at a single corner, and one can lie entirely inside the other. Figure 2 shows those cases.
Write a program that counts how many regions the sides of the rectangles cut the plane into.
Input
The input consists of several datasets. Each dataset has the following format.
n
l1 t1 r1 b1
l2 t2 r2 b2
...
ln tn rn bn
The first line of a dataset holds the number of rectangles on the plane, . ()
Each of the next lines describes one rectangle with four integers , , , separated by single spaces. is the x-y coordinate of the top left corner of the -th rectangle, and is the coordinate of its bottom right corner. (, )
The last line of the input holds a single 0.
Output
For each dataset, print on one line how many regions the sides of the rectangles cut the plane into. The whole plane is counted, so the unbounded region outside every rectangle counts as one region.
Hint
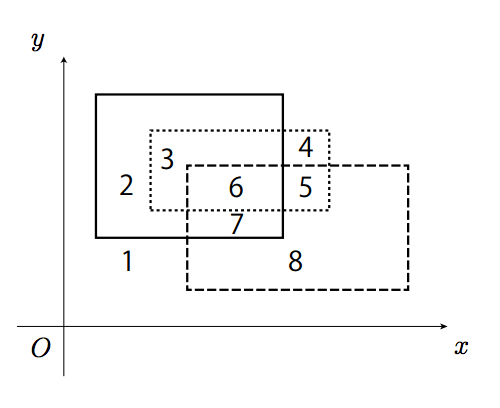
Figure 1. Three rectangles cut the plane into eight regions. This is the first dataset of the example. The x-axis and the y-axis are drawn only to help read the picture, so they do not cut the plane.
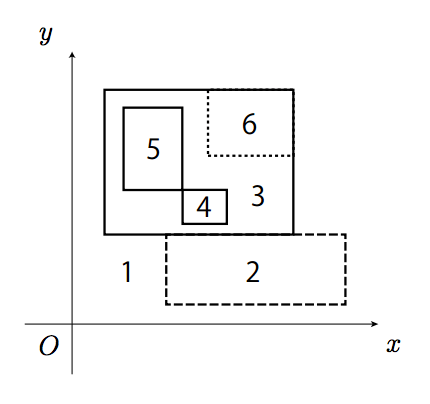
Figure 2. Rectangles overlapping in more complicated ways. This is the second dataset of the example.