Largest Stock Price Decline
InterviewTime limit5sMemory limit256 MB
Given up to a million prices from a sine-cosine formula, find the largest drop from an earlier price to a later one.
Problem
Fatima Cynara is an analyst at Amalgamated Artichokes (AA). Like any company, AA has had good years and bad ones. Fatima studies the trend of the AA stock price, and she wants to know the largest decline in the price over a given span of time. Suppose the prices over a span were 19, 12, 13, 11, 20 and 14. Then the largest decline is 8, from the first price to the fourth. If the last price were 10 instead of 14, the largest decline would be 10, between the last two prices.
From her earlier analyses Fatima found that the stock price over any period can be modelled accurately enough by
where , , , and are constants and the angles of the sine and the cosine are in radians. Consider only integer values of . The decline between two prices and with is . Find the largest decline in the sequence of prices.
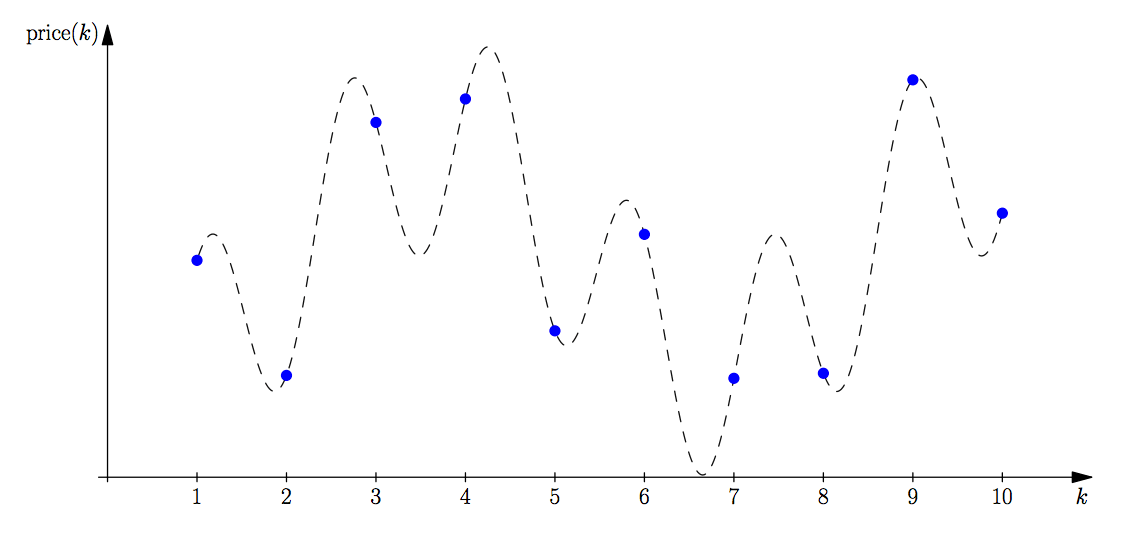
The figure above shows the price function of the first example. The largest decline runs from the fourth price to the seventh.
Input
The first line holds six integers , , , , and separated by spaces. (, , )
The first five integers are the constants of the price function. The prices to consider are , , , .
Output
Print the largest decline in the stock prices on one line, rounded to six decimal places. If the prices never decline, print 0.000000.