Ceiling Function
InterviewTime limit5sMemory limit512 MB
Insert each prototype's values into a binary search tree in order, then count how many distinct tree shapes appear across the prototypes.
- Level
Medium4 of 10
- Topics
- Tree, Implementation, Hash map
- Solved
- No attempts yet
Problem
Advanced Ceiling Manufacturers (ACM) analyzes the properties of its new line of Incredibly Collapse-Proof Ceilings (ICPCs). One ICPC is built from a stack of material layers, and every layer has its own collapse resistance, measured as a positive integer. The analysis ACM plans to run takes the collapse-resistance values of the layers, stores them in a binary search tree, and checks whether the shape of that tree says anything about the quality of the whole ceiling. Because, well, why should it not?
ACM reads the collapse-resistance values in order from the top layer to the bottom layer and inserts them one by one into a tree. The rules for inserting a value are:
- If the tree is empty, make the root of the tree.
- If the tree is not empty, compare with the root. If is smaller, insert into the left subtree of the root, otherwise insert into the right subtree.
ACM has a set of ceiling prototypes it wants to analyze by trying to collapse them. It groups the prototypes whose trees have the same shape and analyzes each group together.
Take the five prototypes of three layers each from the first example below. The first prototype has collapse-resistance value 2 in its top layer, 7 in the middle layer, and 1 in the bottom layer. The second prototype has layers 3, 1, and 4, yet both prototypes induce the same tree shape, so ACM analyzes them together.
Given a set of prototypes, determine how many different tree shapes they induce.
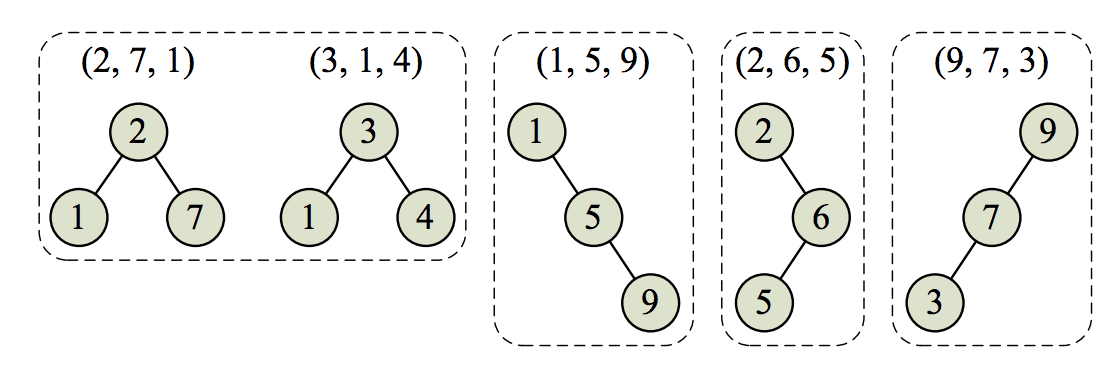
The figure above shows the four tree shapes induced by the prototypes in the first example.
Input
The first line contains two integers (), the number of ceiling prototypes to analyze, and (), the number of layers in each prototype.
Each of the next lines describes one prototype. Such a line contains distinct integers between and , inclusive, which are the collapse-resistance values of the layers ordered from top to bottom.
Output
Print the number of different tree shapes.