Voronoi Diagram Point Query
Time limit10sMemory limit1024 MB
Classify each query point by which Voronoi cells contain it: none, one region index, a bisector line of two, or a vertex of three or more.
- Level
Medium7 of 10
- Topics
- Geometry, Brute force, Implementation
- Solved
- No attempts yet
Problem
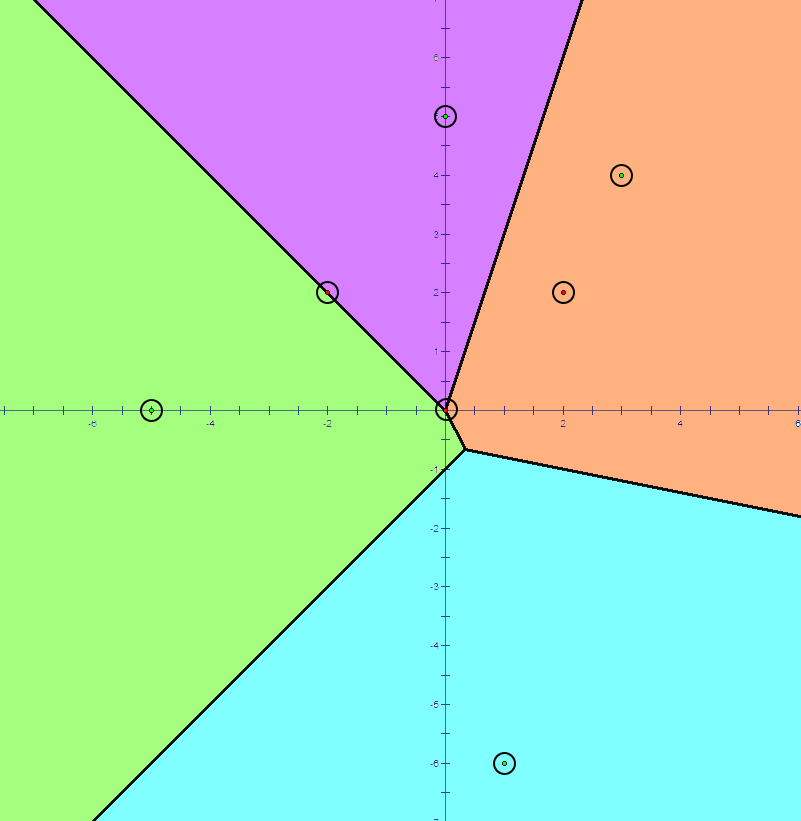
Figure: Voronoi diagram of size 4.
In the 2-dimensional Cartesian coordinate system, we define the Voronoi diagram of a non-empty set of points as a diagram that divides the plane by the criterion "which point in the set is closest at this location?". More precisely, the Voronoi diagram of a given non-empty point set is a collection of regions: a point is included in region if and only if holds for all , where is the Euclidean distance between points and .
For example, in the picture above, every location on the plane is colored by the closest point to that location. Points that belong to a single region are colored with a light color indicating that region, and points that belong to more than one region form lines and points colored black.
There is an algorithm that computes the Voronoi diagram in , but it is infamous for being very complicated and difficult. We are lenient problem setters, so we set , which means you can solve this task with slower Voronoi diagram algorithms.
In this task, you should solve the point query problem in a Voronoi diagram: in the Voronoi diagram constructed from the point set , you should determine which region(s) the point belongs to. More precisely, you are given point queries. For each query point, you should determine the following:
- If it is not included in any region, output
NONE. - If it is included in exactly one region, output
REGION X, where is the index of that region. - If it is included in exactly two regions, output
LINE X Y, where and ( < ) are the indices of those two regions. - If it is included in three or more regions, output
POINT.
Input
The first line gives the number of points forming the Voronoi diagram, , and the number of queries, . ()
The -th of the next lines gives two integers indicating the and coordinates of . These are the points that form the Voronoi diagram. All points are distinct. ()
The -th of the next lines gives two integers indicating the and coordinates of . For each point , you should determine which region(s) it belongs to. ()
Output
The output consists of lines. In the -th line, print one of the following:
- If is not included in any region, output
NONE. - If is included in exactly one region, output
REGION X, where is the index of that region. - If is included in exactly two regions, output
LINE X Y, where and ( < ) are the indices of those two regions. - If is included in three or more regions, output
POINT.