Automatic Sprayer
InterviewTime limit1sMemory limit512 MB
Given the 8x8 yields after sprayers were placed, recover which plots hold a fertilizer sprayer, a herbicide sprayer, or nothing.
- Level
Medium5 of 10
- Topics
- Brute force, Implementation, Simulation, Matrix
- Solved
- No attempts yet
Problem
A farm is divided into an 8×8 grid of unit plots. To grow a large amount of crops, the farm has automatic sprayers installed in unit plots that spray fertilizer or herbicide. A sprayer sprays liquid from its location in the four directions: up, down, left, and right. For example, if a sprayer is placed in plot X, the unit plots that receive liquid from the device are {X,a,b,c,d,e,f,g,h,i,j,k,l,m,n}. If a sprayer is placed in plot Y, the unit plots that receive liquid are {Y,A,B,c,C,D,E,F,G,H,I,J,k,K,L}.
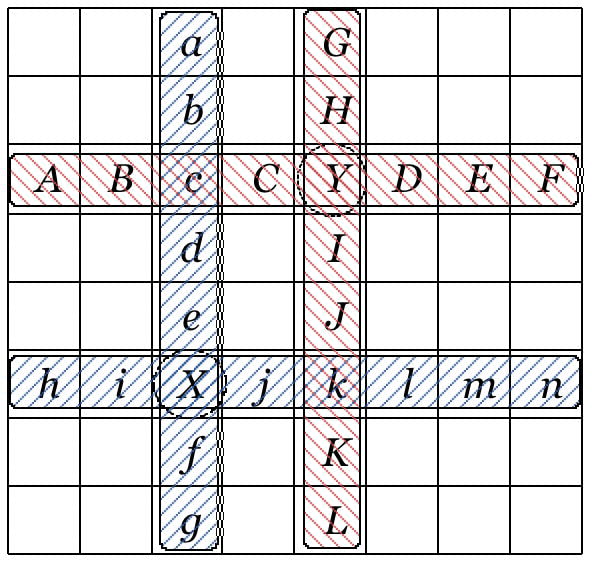
When no automatic sprayer is installed, every unit plot yields exactly the same amount, called the base yield. After a sprayer is installed, a unit plot sprayed with fertilizer increases its yield by 1, and a unit plot sprayed with herbicide has weeds and pests removed but decreases its yield by 1. Let the base yield be 30. If a fertilizer sprayer is installed in plot X and a herbicide sprayer is installed in plot Y, the final yields are as follows.
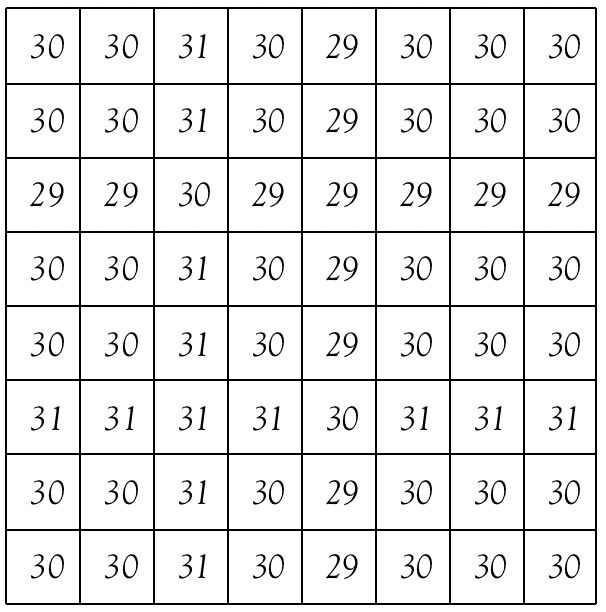
At most one automatic sprayer can be placed in a unit plot. Therefore, a herbicide sprayer and a fertilizer sprayer cannot be placed in the same unit plot at the same time, and two or more sprayers of the same kind cannot be installed there.
Given the final yield data of an 8×8 farm with base yield M, write a program that finds the positions and kinds of the installed automatic sprayers.
Input
The first line contains the base yield M (30 ≤ M ≤ 40). The next 8 lines give the final yields of the entire 8×8 farm, one line from top to bottom. The yields of the 8 unit plots on the same line are separated by spaces. All values are positive integers.
Output
For each unit plot, in the order read from the input, print whether an automatic sprayer is present and its kind, over a total of 8 lines. A unit plot with a fertilizer sprayer is represented by the symbol ‘+’, a unit plot with a herbicide sprayer by the symbol ‘-’ (minus), and a unit plot with no sprayer by the symbol ‘.’. The unit plot information on the same line is separated by a single space.