Radar Chart
Time limit2sMemory limit1024 MB
Count the orderings of 8 stats around the octagon so that the radar chart is a convex polygon.
- Level
Medium4 of 10
- Topics
- Brute force, Geometry, Implementation
- Solved
- No attempts yet
Problem
A radar chart is a common way to show a game character's stats at a glance. A character has 8 stats. If the stats are , the graph is an octagon, and the -th vertex is away from the origin in the direction of degrees.
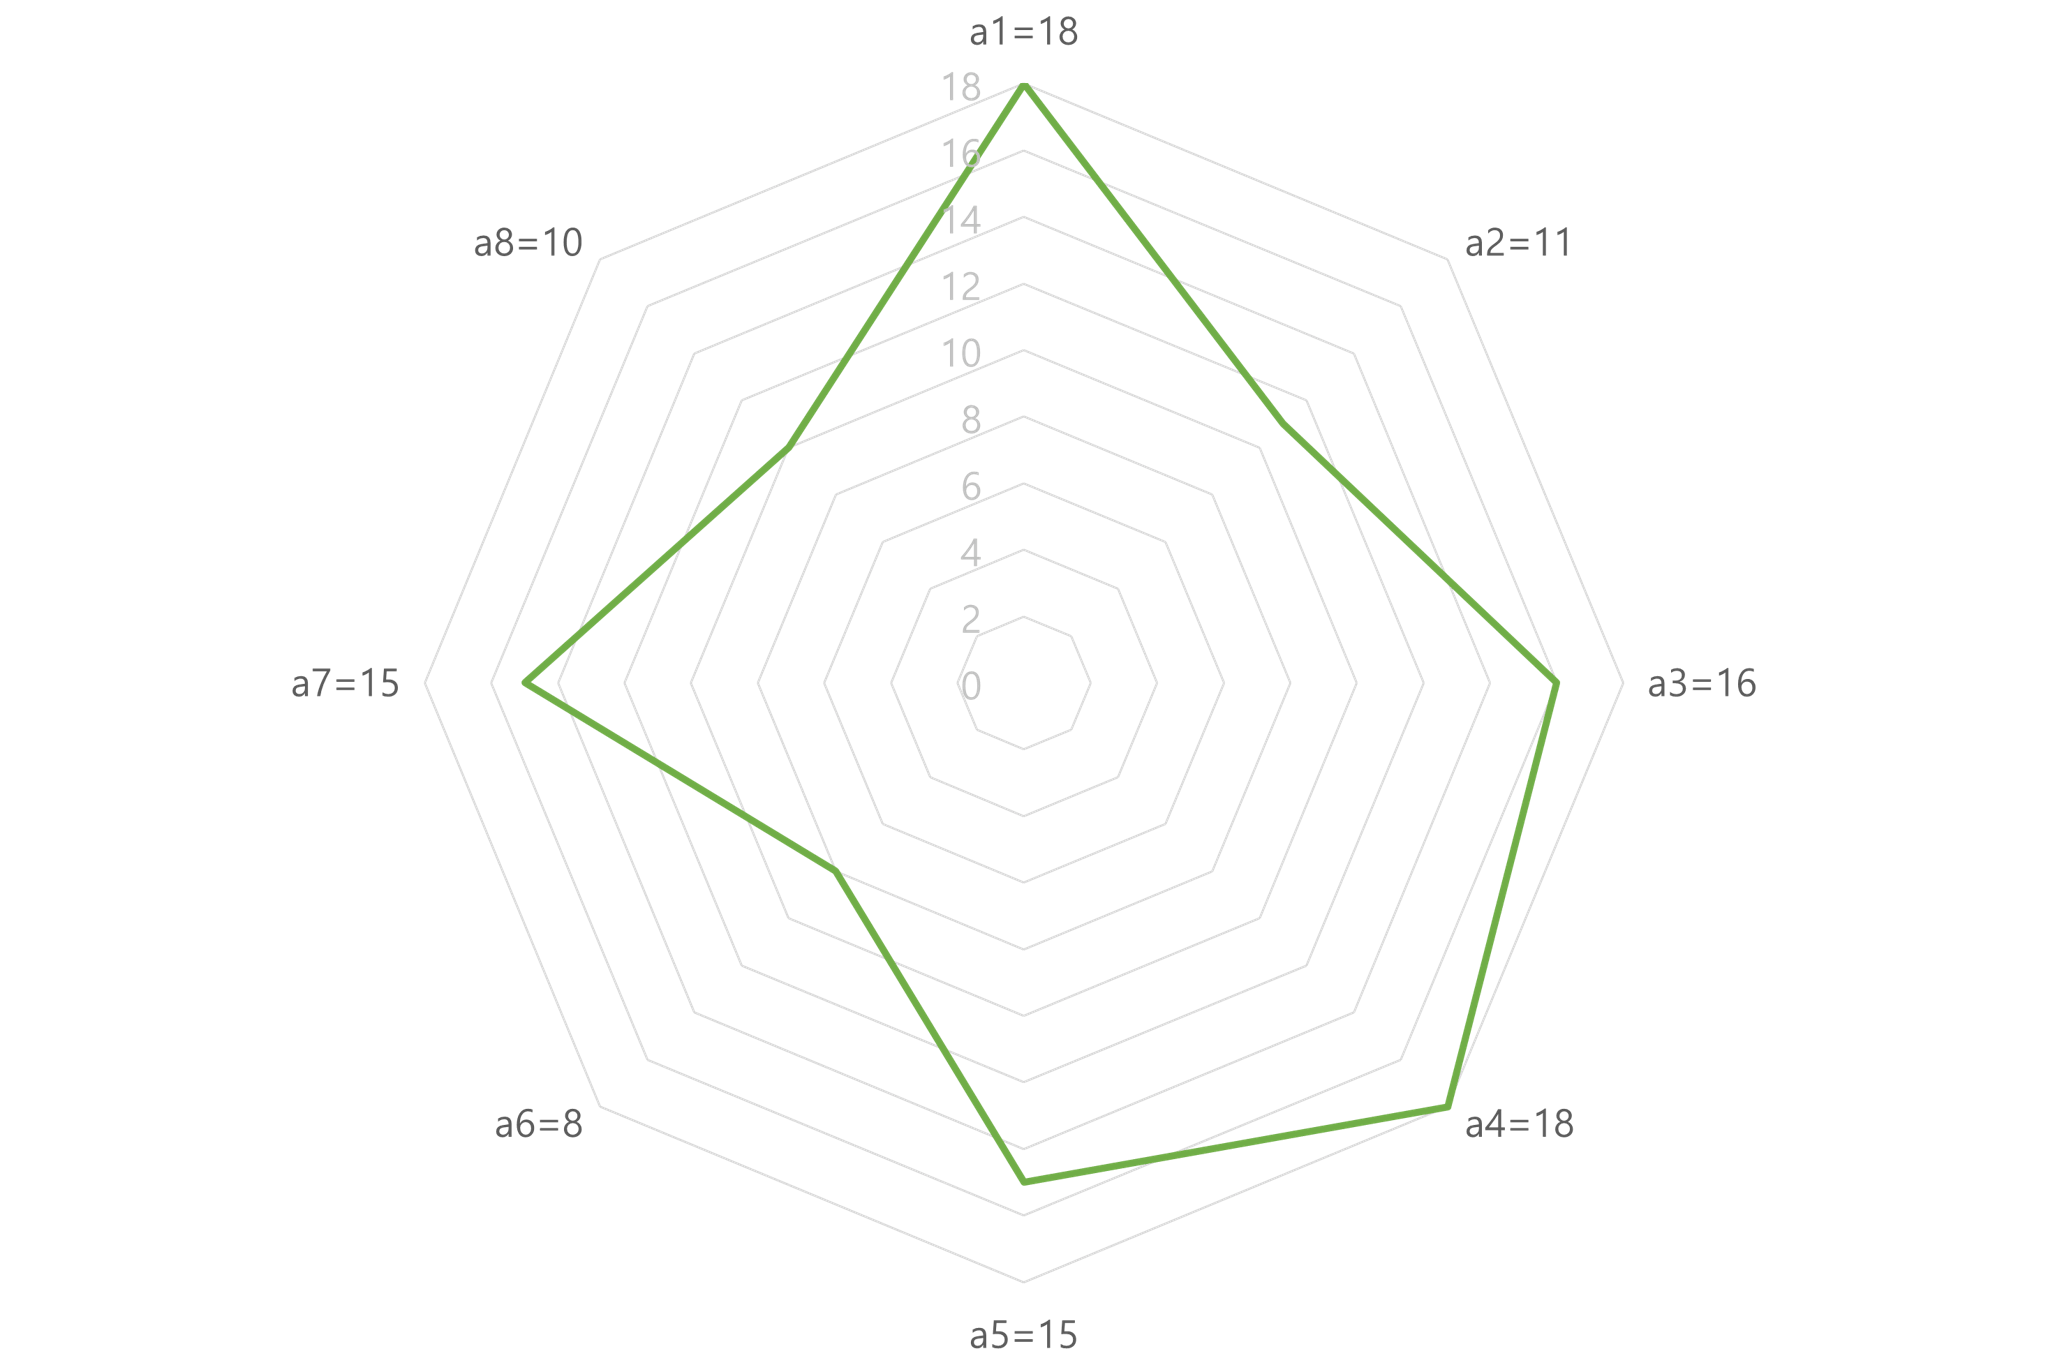
A radar chart shows how evenly the stats are distributed. If all stats are equal, the shape is a regular polygon. If one stat is much lower than the others, the polygon is concave. Many people try to make the graph a convex polygon, meaning every interior angle is at most , so that they can remove their weak spots.
Siru wants to turn his graph into a convex polygon, but raising stats is tedious. So he came up with a trick: change the order in which the stats are listed. For example, the list gives a concave polygon, but the list gives a convex polygon.
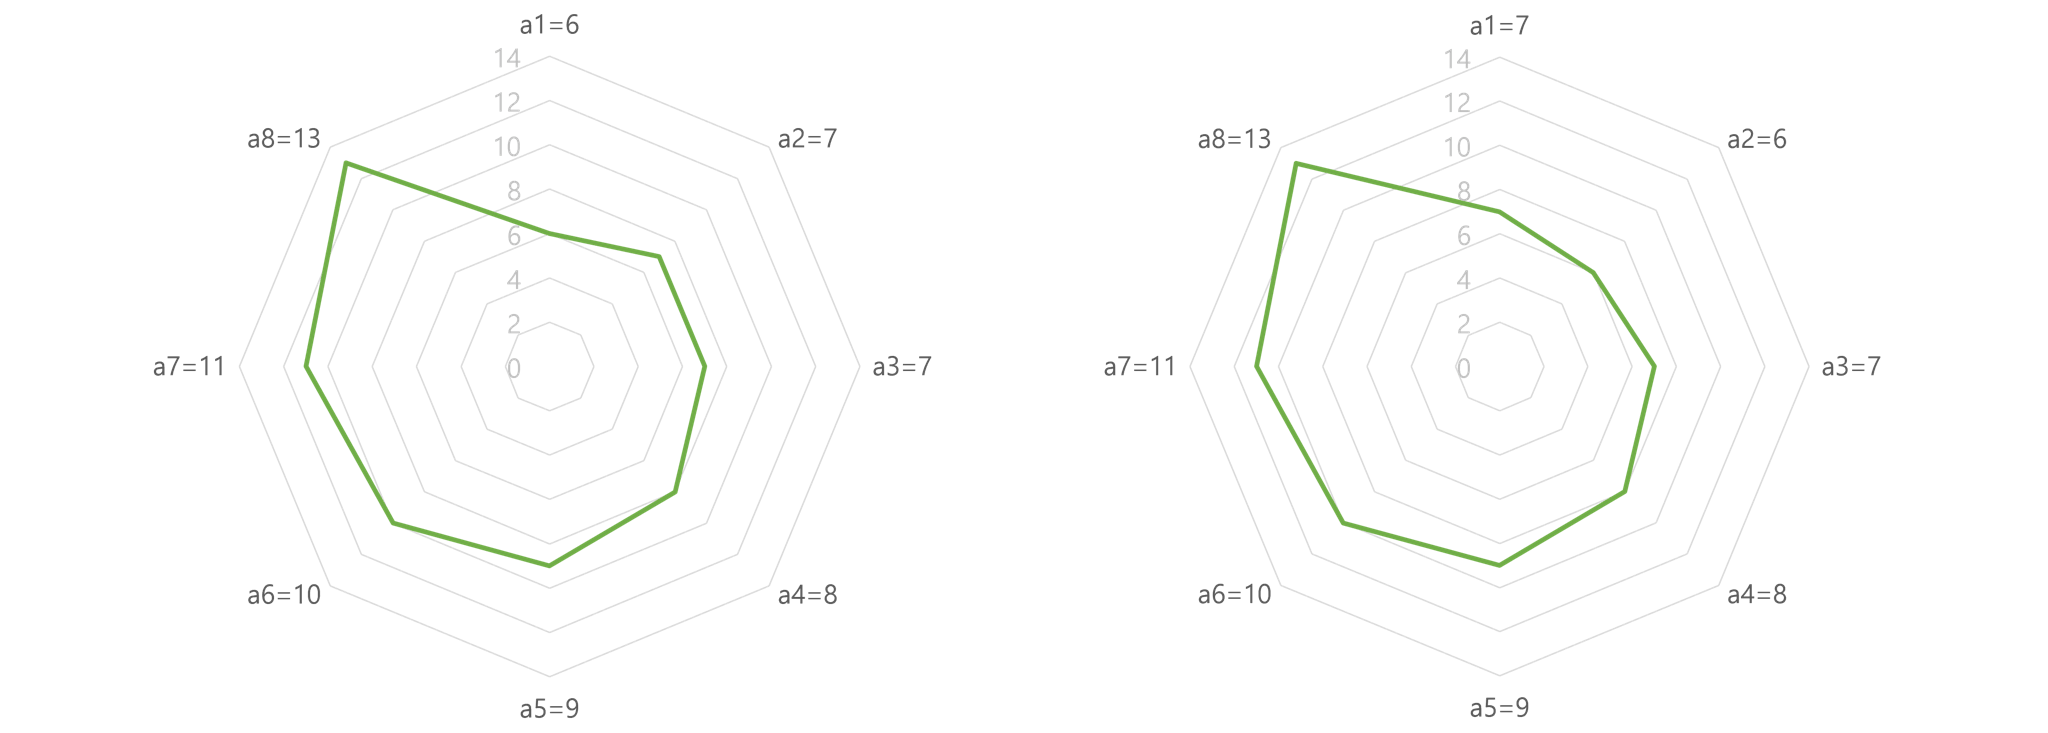
The order of the stats decides whether the polygon is concave or convex. Find the number of ways to arrange the stats so that the radar chart is a convex polygon.
Input
The first line contains 8 integers , the stats, separated by spaces. ()
Output
Print the number of ways to arrange the 8 stats so that the radar chart is a convex polygon.