Cloud Over the City
Time limit2sMemory limit1024 MB
Given vertical and horizontal street strips and a cloud that shifts by a fixed vector each second, compute the total snow falling on the streets over T seconds.
- Level
Medium6 of 10
- Topics
- Prefix sum, Sorting, Binary search, Math
- Solved
- No attempts yet
Statement
Leonard Hofstadter recently returned from an expedition to the North Pole. The goal was to create special clouds that snow pink. In Leonard's view, this is the best gift any girl could get.
Unfortunately, city officials are not eager to welcome the new attraction. The pink snow falls in large amounts: every second, centimeters of snow falls on each square meter. For some reason, every cloud comes out as a perfect rectangle, which spoils the view.
Leonard has only one chance to win the officials over: run a test by watching a scaled-down model of the city for seconds. The model is a huge rectangle with all city streets marked on it. Every street is treated as an infinite strip parallel to either the left or the bottom edge of the model. The test runs as follows. The cloud is placed over the model with its sides parallel to the model's sides, and its bottom left corner coincides with the bottom left corner of the model. Then the wind is simulated: for one second the cloud stays still, then instantly moves by a given vector, and this repeats for all seconds. Until the test starts, the model is kept strictly secret and can look almost any way. For example:
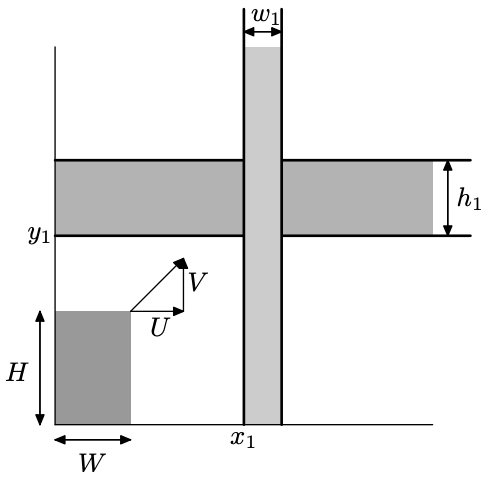
Tonight Leonard received a letter from an anonymous pink snow enthusiast. The letter described in detail the model, the cloud, and the wind that will be simulated in the upcoming test. Leonard asks you to calculate how much snow will fall on the streets of the model during this test.
Input
The first line contains four integers , , , : the number of streets parallel to the left edge of the model, the number of streets parallel to the bottom edge, the observation time, and the amount of snow falling per square meter per second (, , , ).
The second line contains four integers , , , : the side lengths of the cloud parallel to the left and bottom edges, and how much the distance from the cloud to the left and bottom edges grows with each shift, respectively (, ).
Each of the next lines contains two integers , : the distance from the left edge of the model to the left side of a street, and its width (, ).
Each of the next lines contains two integers , : the distance from the bottom edge of the model to the bottom side of a street, and its width (, ). No two parallel streets intersect or share a side.
Output
Print a single number: the amount of snow that falls on the streets of the model during the observation time.