 cho.sh
X-percent Blooming
아직 제출이 없습니다시간 제한2초메모리 제한512 MB문제
Spring is coming. Cherry blossom forecast is one of the things we feel spring is just around the corner. International Cherry-blossom Prediction Committee (ICPC) is an organization that announces the state of cherry blossoms every spring. Your task as a staff of the organization is to observe a specific cherry tree and evaluate the level of the blossom of the cherry tree.
The tree that you observe can be considered as a graph tree. There is a root node with no parent node, and the other nodes have only one parent node. Let be the minimum distance from node to the leaf nodes of the subtree of . Here, a leaf node is a node that has no child nodes. Then a node blooms if at the time you observe. On the other hand, at full blossom, a node blooms if . The level of cherry blossom is evaluated as the ratio of the numbers of blooming nodes at the time you observe and full blossom. More formally, let be the number of nodes satisfying . The level of cherry blossom is defined as .
Note that the tree is also growing. When the tree grows, a new node is added to a node as a child node. So the number of nodes might be increased between your observations.
Initially, the tree had only one node, which is the root node. You recorded the growth and observation time but forgot to record the level of cherry blossom on each observation. Now, your new task is to restore the data of the levels of cherry blossom from the given records.
For Sample 1, the tree at the first observation looks like the figure below, where green border means a node is a leaf and pink circle means a node that blooms. The left tree represents a tree without blossom. The center tree represents blossom at the time you observe and the right tree represents full blossom.
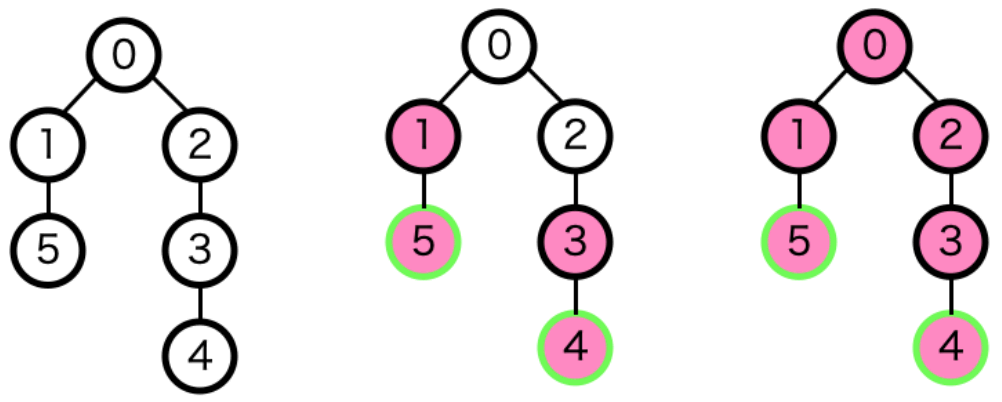
Figure J-1. First observation of Sample 1
Similarly, the following figure illustrates the second observation of Sample 1.
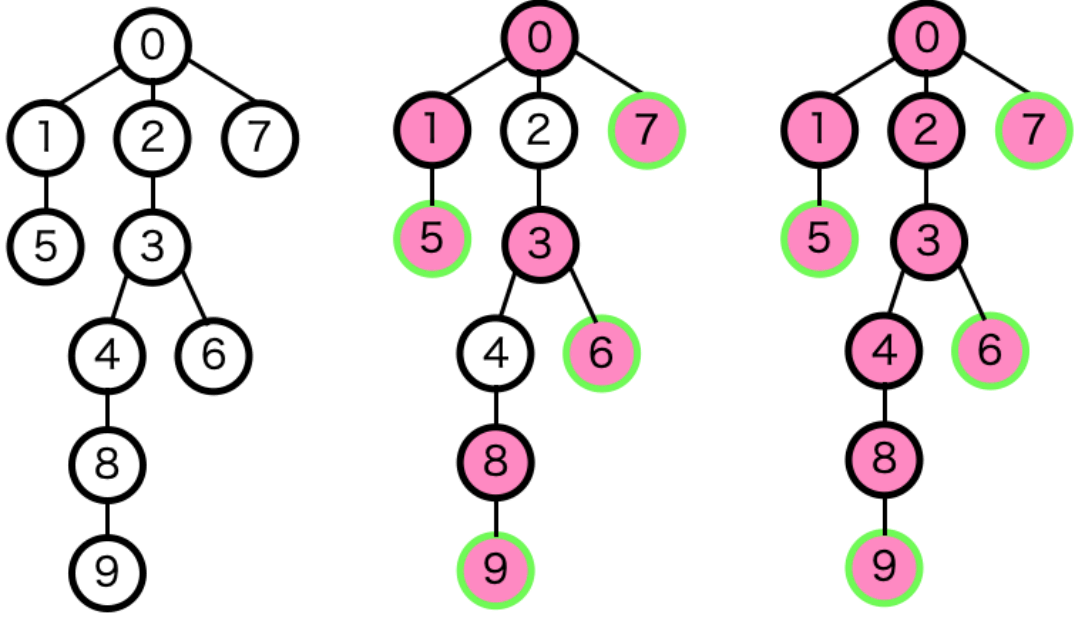
Figure J-2. Second observation of Sample 1
입력
The input consists of a single test case in the format below.
The first line contains three integers (), (), (). is the number of records you stored. is the threshold of distances to determine blooming nodes at the time you observe. is the threshold of distances to determine blooming nodes at full blossom. The -th of the following lines represents the -th recorded event. An event is either of two types of events:
- Growth event: a new node is added as a child node of the -th added node, where the root node is the -th added node. For this type of event, is ' '.
- Observation event: evaluate the level of cherry blossom on the state of the tree at that time. For this type of event, is ''. Note that whether each node bloomed in the past does not matter to the current observation. The node does not bloom even if bloomed in the past when the current .
출력
For each observation event, output the level of cherry blossom per line in the order of the events. Absolute or relative errors less than are permissible for each level.