 cho.sh
Venn Intervals
아직 제출이 없습니다시간 제한3초메모리 제한1024 MB문제
A Venn interval diagram is a graphical way to illustrate intersections of sets in 1D, similar to the more familiar Venn diagrams in 2D. A Venn interval diagram is defined by assigning a non-zero-length integer interval to each set . The regions where different intervals overlap correspond to intersections of different combinations of the sets (see Figure N.1).
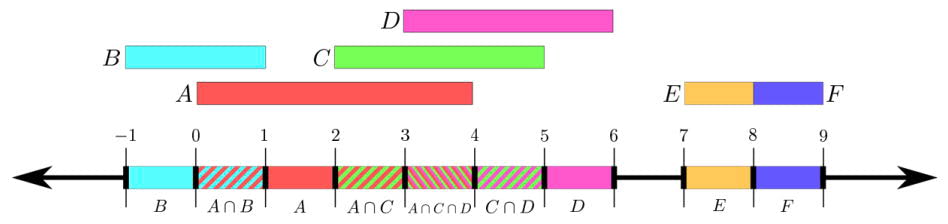
Figure N.1: Venn interval diagram corresponding to Sample Input 1. The intervals assigned to each of the six sets through are shown at the top; the regions encoded by the diagram are labeled along the number line. This Venn interval diagram has nine regions, and is not degenerate (since no interval is contained in any other.)
More formally, given the interval assigned to each set, you can compute the regions that appear in the Venn interval diagram with the following algorithm:
- Combine together all of the interval starting points and ending points into a single set, and sort them to get an integer sequence .
- Label each interval spanning consecutive values with all the sets for which is contained within . (Note that partial overlaps are not possible: the -interval is either contained within, or disjoint from, each set-interval).
- The set of all non-empty labels are the regions of the Venn interval diagram. Each label represents an intersection of sets .
In the example Venn interval diagram shown above, there are six sets ( through ) and nine regions (, , , , , , , , and ). This example Venn interval diagram has a “hole” where no sets overlap (between the end of region and the start of ); this is allowed. Note also that is not a region: and ’s intervals touch at their endpoints, but the two do not overlap on a -interval.
Not every list of regions has a corresponding illustration as a Venn interval diagram. Consider for example the regions , , and . There is no way to lay out intervals for , , and on the real line to form exactly these three regions (any Venn interval diagram that includes these three regions must also include ). In addition, a Venn interval diagram is degenerate if any interval is contained within another interval: if and for some . For example, if ’s right endpoint were at instead of , the Venn interval diagram in Figure N.1 would become degenerate, since the interval assigned to the set would then be contained within ’s interval (corresponding to Sample Input 3).
Given a list of regions, construct a non-degenerate Venn interval diagram containing exactly those regions, if possible.
입력
The first line of the input contains a single integer , the number of regions required in your diagram (). The next lines each describe one region. Each line begins with an integer , the number of sets that intersect to form the region (), followed by space-separated set names. Each set name contains only lowercase or uppercase letters (a-z, A-Z) and no set name is longer than ten characters. All set names listed on the same line are distinct, and no two regions list the exact same collection of set names. No more than unique set names appear in total across all regions.
출력
If a non-degenerate Venn interval diagram does not exist whose regions match the input, print IMPOSSIBLE and produce no further output.
Otherwise, print the intervals describing any one valid diagram. For each set name that appears in the input, print a line of output starting with that set name, followed by two space-separated integers and : the left and right endpoints of the interval assigned to that set name in your diagram. The endpoints must satisfy . You may list the sets in any order, but every set name that appears in the input must correspond to exactly one line of output.
Every region in the input must appear at least once in your Venn interval diagram, and your diagram must not contain any regions other than those specified in the input. You diagram must not be degenerate: no interval should be enclosed inside another.